Benchmark Overview
Compare your fleet's component performance against industry failure data with lifecycle analytics, reliability curves, and risk scoring.
Overview
The Benchmark module lets you compare your fleet's real-world component performance against failure data from OEMs, industry peers, and internal history. It answers the question: "Are my components lasting as long as they should?"
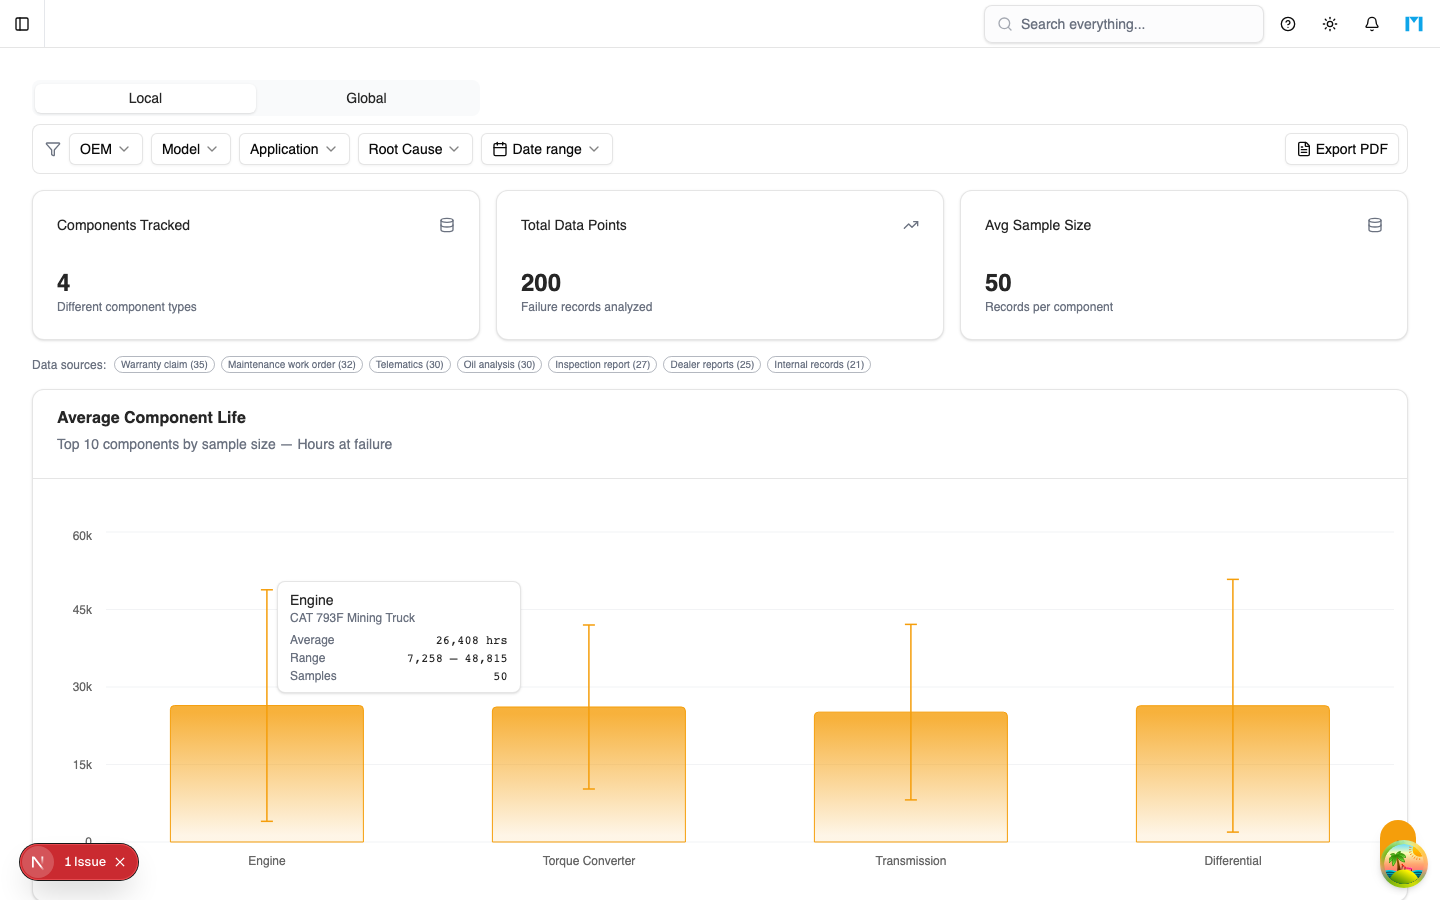
Benchmark is available from the sidebar when you navigate to Benchmark in the top-level navigation.
Key Concepts
Local vs Global Scope
The Benchmark page has two tabs:
- Local — filters benchmark data to OEMs and models that exist in your fleet. This is the default view and shows the most relevant comparisons.
- Global — shows all benchmark data in the tenant regardless of fleet composition.
Benchmark Data
Each benchmark data entry records a single component failure event with these fields:
- Component — the component catalog item that failed.
- OEM / Model — the equipment manufacturer and model.
- Hours at Failure — the machine hours when the failure occurred.
- Application — the operating context (e.g., "Hard Rock", "Soft Overburden").
- Root Cause — the failure mode or root cause category.
- Data Source — where the data came from (e.g., "OEM Bulletin", "Internal", "Industry Report").
- Occurred At — the date of the failure event.
Benchmark data is managed by admins through the Admin > Benchmark Management page, where entries can be created individually or bulk-imported via CSV.
Filters
The Benchmark page provides a compact filter bar with multi-select dropdowns for:
- OEM — filter by equipment manufacturer (Local tab only).
- Model — filter by equipment model (Local tab only).
- Application — filter by operating context.
- Root Cause — filter by failure mode.
- Date Range — filter failures within a date window, with presets for Last 6 months, Last year, and Last 2 years.
Active filters appear as removable badges. Click Clear all to reset.
Dashboard Cards
The top of the page shows three summary cards:
- Components Tracked — the number of distinct component types with data.
- Total Data Points — the total number of failure records analyzed.
- Avg Sample Size — the average number of records per component.
Charts and Analysis
Average Component Life
A bar chart showing the top 10 components by sample size with their average hours at failure, plus error bars showing the min-max range.
Failure Trend Over Time
A scatter plot of all failures over time with a linear regression trend line. The trend badge shows whether component lives are improving, degrading, or stable.
Root Cause Distribution
A breakdown of failure root causes across the dataset, shown as a chart. A second chart shows root causes segmented by component (top 10 components).
Component Lifecycle Details
A table listing every component with its model, average life, min/max range, and sample size. Sample size is color-coded: green for 10+ samples (high confidence), amber for 5-9 (medium), and red for fewer than 5 (low).
Fleet vs Benchmark Comparison
Compares your fleet's actual maintenance intervals against benchmark averages. Each row shows the component, fleet average hours, benchmark average hours, the delta percentage, and a status indicator (above/at/below benchmark).
Utilization-Adjusted Comparison
Adjusts benchmark averages based on your fleet's actual daily utilization versus a standard 16-hour mining day, giving a fairer comparison.
Vehicle Risk Assessment
Scores each vehicle by comparing its current lifetime hours against benchmark MTBF for each component. Vehicles with components approaching or exceeding their expected life are flagged as warning (>70% of MTBF) or critical (>90%).
Cost Impact Analysis
Cross-references maintenance costs with benchmark MTBF to estimate the annual cost exposure per component across the fleet.
Seasonal Analysis
Shows failure counts by calendar month to identify seasonal patterns in component failures.
Site Comparison
Compares component performance across different mine sites, showing how each site deviates from the fleet-wide average.
Component Hierarchy
Groups components by their parent in the component catalog, rolling up failure counts and average hours to parent level.
Notes Search
Search through notes attached to benchmark data entries.
Model Detail View
When you select one or more models in the filter bar, a tabbed detail view appears below the main charts:
- General tab — a summary table showing machine count and change-out counts by model and component.
- Component tabs — one tab per component with detailed analysis:
- Distribution sub-tab — histogram of failure intervals, probability distribution, percentile chart (50th/75th/100th), model comparison (when 2+ models selected), and application-stratified analysis.
- Reliability sub-tab — Weibull reliability analysis with survival curves and hazard rates.
Forecast and TCO Integration
- When models are selected, a Forecast from Benchmark section generates maintenance forecasts based on benchmark MTBF data.
- When a single model is selected, a Benchmark-TCO Bridge links benchmark lifecycle data to the TCO (Total Cost of Ownership) module.
PDF Export
Click Export PDF in the filter bar to generate a downloadable PDF of the current benchmark report with all visible charts and tables.
Common Questions
Where does benchmark data come from?
Admins import it through Admin > Benchmark Management. Data can come from OEM service bulletins, industry reports, or your own historical maintenance records.
What is the minimum sample size for meaningful analysis?
The system flags samples under 5 as low confidence and under 10 as medium. For Weibull reliability analysis, at least 3 data points are required.
Can I compare across tenants?
No. Benchmark data is tenant-scoped. Each organization manages its own dataset.