Dashboard
The lifecycle dashboard provides a real-time operational overview of your mining fleet with KPIs, charts, and recent activity.
Overview
The lifecycle dashboard is the landing page for the lifecycle module, accessible at /t/{slug}/lifecycle. It aggregates data from across the platform -- vehicles, work orders, meter readings, forecasts, parts, downtime, and financial records -- into a single view. All dashboard queries are scoped to the current tenant and cached for 60 seconds to keep the page responsive.
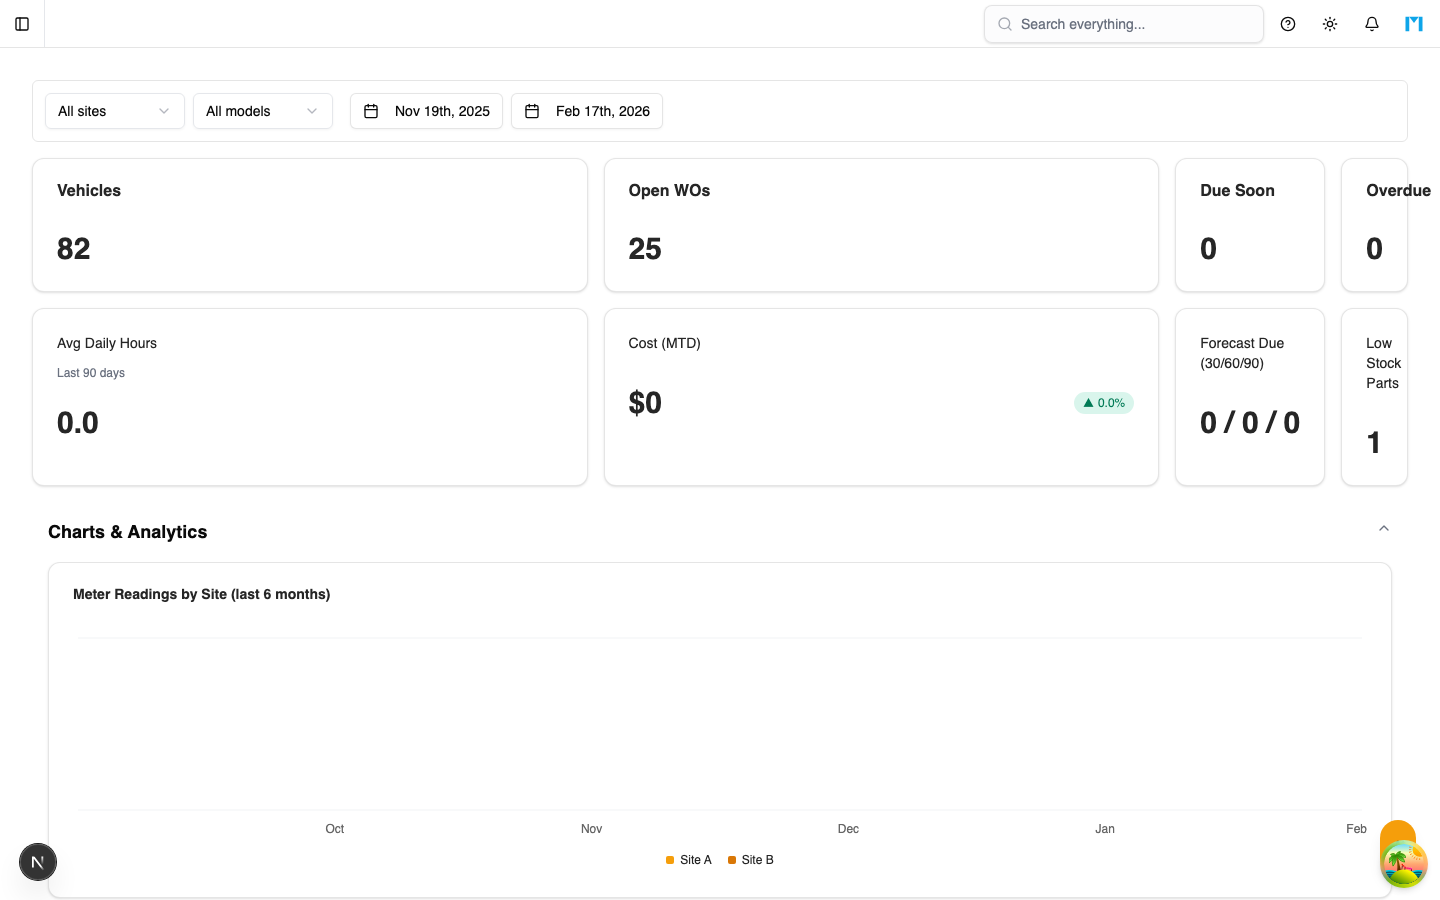
Key Metrics
The top of the dashboard displays four summary cards:
| Card | Source | Description |
|---|---|---|
| Vehicles | FleetVehicle count (active, not soft-deleted) | Total number of vehicles in the fleet |
| Open WOs | Work orders with status OPEN or IN_PROGRESS | Count of active work orders |
| Due Soon | Forecast events with status DUE_SOON | Components or tasks approaching their target hours |
| Overdue | Forecast events with status OVERDUE | Items past their projected maintenance window |
Below those, a second row of KPI cards shows:
- Avg Daily Hours -- average daily utilization across vehicles over the last 90 days, calculated from meter reading deltas.
- Cost (MTD) -- month-to-date total cost summing PURCHASE, FUEL, MAINTENANCE, LABOR, and PARTS financial records, with a percentage delta compared to the prior month.
- Forecast Due (30/60/90) -- count of forecast events due within 30, 60, and 90 day horizons.
- Low Stock Parts -- count of parts where
stockLevel < minStock.
Filters
A filter bar at the top lets you narrow dashboard data by:
- Site -- select a specific mine site.
- Model -- filter by equipment model name.
- Date range -- defaults to the last 90 days. Affects the heatmap, utilization, and other time-based widgets.
Filters are applied to the utilization summary, daily hours heatmap, and vehicle KPIs queries.
Charts and Analytics
The charts section is collapsible and contains the following visualizations:
Meter Readings by Site
An area chart showing meter reading counts for the top two sites (by volume) over the last 6 months. Sites are identified by resolving vehicle-to-site relationships.
Fleet Status
A donut pie chart showing the distribution of vehicles across statuses: ACTIVE, MAINTENANCE, and INACTIVE.
Work Order Aging
A stacked bar chart grouping open, in-progress, and blocked work orders into age buckets: less than 7 days, 8--14 days, 15--30 days, and over 30 days. Helps identify stale work orders.
Cost Breakdown
A stacked bar chart showing monthly cost breakdown by type (PURCHASE, FUEL, MAINTENANCE, LABOR, PARTS) over the last 6 months. Can be filtered by site.
Fleet Distribution
A grouped bar chart showing vehicle counts by site and equipment model combination.
Daily Usage Heatmap
A calendar-style heatmap showing daily operating hours derived from meter reading deltas. The grid spans up to 8 weeks by default and responds to date range and site/model filters.
Vehicle KPIs (Radar Chart)
A radar chart displaying six normalized metrics for the top 5 vehicles (by lifetime hours):
- Utilization -- daily hours as a percentage of 18-hour max.
- Maintenance Intensity -- maintenance log count over 90 days, normalized to 6 events.
- Cost Per Hour -- total financial + maintenance + fuel cost divided by operating hours.
- Forecast Risk -- weighted count of DUE_SOON and OVERDUE forecasts.
- Backlog -- count of open/in-progress work orders.
- Availability -- active days out of the last 30.
Downtime by Week
A stacked bar chart showing downtime minutes grouped by week and category: BREAKDOWN, PREVENTIVE, OPERATOR, WEATHER, and OTHER.
Fuel Trend
A line/bar chart showing monthly fuel consumption in liters over the last 6 months.
Recent Activity
The activity section (also collapsible) includes:
Recent Work Orders
A table showing the 5 most recently created work orders with columns for title, vehicle serial and site, status (with color-coded dot), priority (as a badge), and due date.
Low Stock Parts
A list of up to 5 parts where stock is below the configured minimum threshold, ordered by lowest stock first. Shows part number, description, current stock level, and minimum required stock.
Common Questions
Why do some charts show "no data"?
Charts require corresponding records to exist. For example, the fuel trend chart requires FuelTransaction records, and the downtime chart requires DowntimeEvent records. If your tenant has not imported this data, those charts will appear empty.
How is the cost MTD delta calculated?
The system sums all five cost types for the current month and the previous month, then computes the percentage change: ((current - previous) / previous) * 100.
Can I export the dashboard?
The dashboard does not have a built-in export. However, individual data views like work orders and meter readings have their own export capabilities.
How often does the data refresh?
Dashboard queries use a 60-second stale time. Data will automatically refresh when you navigate back to the dashboard or after the cache expires.