Total Cost of Ownership (TCO)
Analyze the total cost of owning and operating mining equipment with scenario modeling, what-if analysis, and profile comparison.
Overview
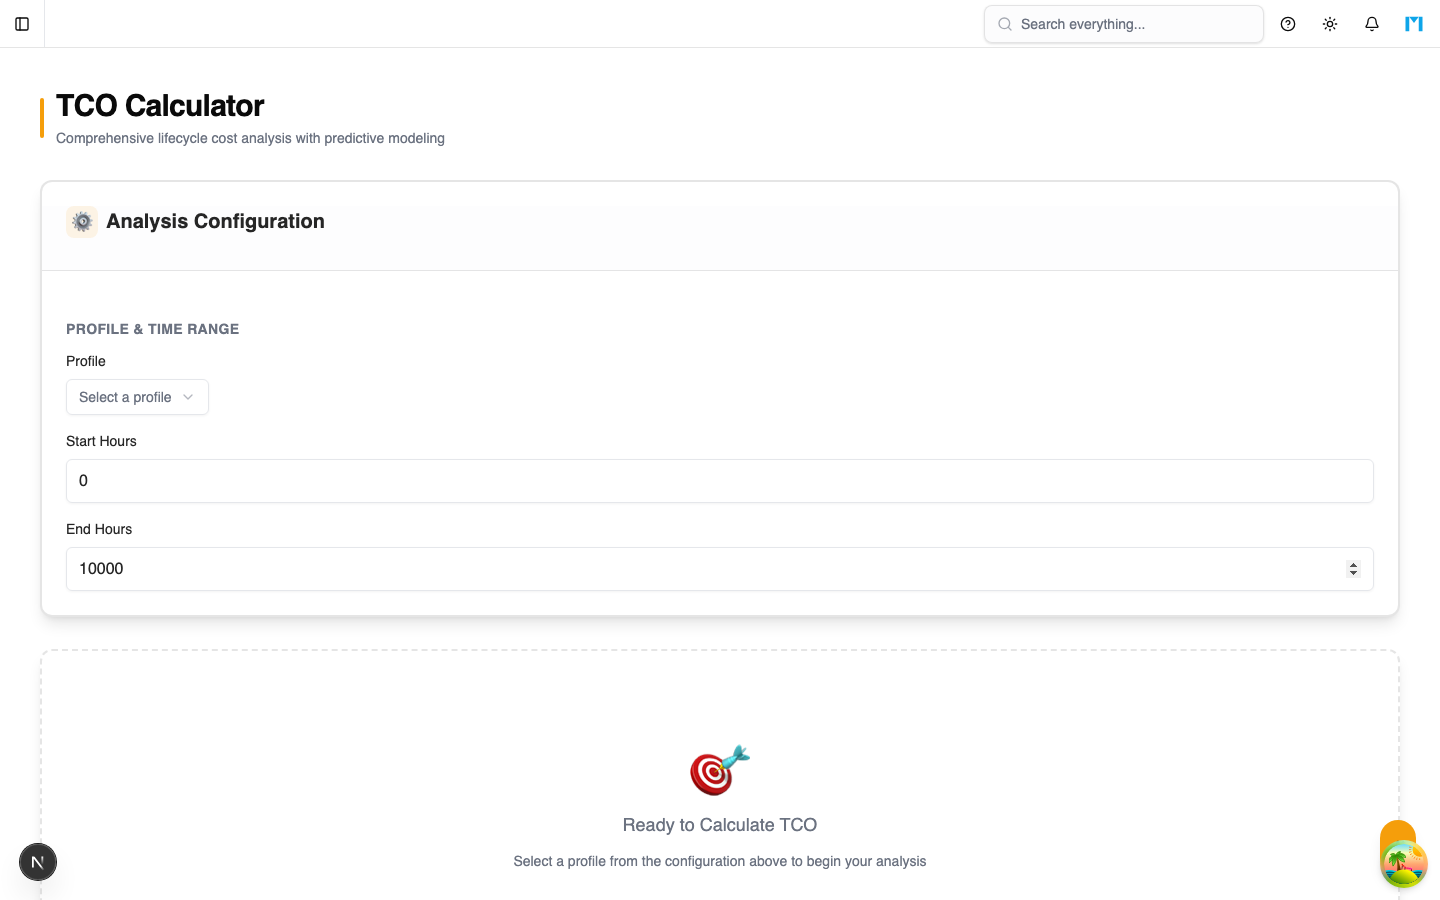
The TCO module helps mining operations understand the full cost of owning and operating equipment over its lifecycle. It combines historical financial data with profile-based maintenance event modeling to calculate cost per hour, cost per tonne, and lifetime ownership costs. The TCO calculator is accessible at /t/{slug}/lifecycle/tco.
MineSync provides two complementary TCO tools:
- Profile-based TCO Calculator (the TCO page) -- models costs from lifecycle profile events with economic escalation factors and what-if scenarios.
- Scenario-based TCO (the API) -- creates named scenarios that aggregate historical financial records across fleet vehicles with optional site and profile scoping.
Profile-Based TCO Calculator
Configuration
The calculator requires three inputs to begin:
- Profile -- select a lifecycle profile that defines maintenance events and their costs.
- Start Hours -- the starting hour meter value (default: 0).
- End Hours -- the ending hour meter value (default: 10,000).
Once a profile is selected, economic factors become available:
| Factor | Default | Description |
|---|---|---|
| Daily Utilization | 12 hours | Hours per day the equipment operates (1--24) |
| FX YoY Change | 0% | Foreign exchange year-over-year change |
| Parts Escalation | 3% | Annual parts price increase |
| Labor Escalation | 2.5% | Annual labor cost increase |
Summary Statistics
Three headline metrics are displayed:
- Total Hours -- the hour range with an estimated operational life in years (based on daily utilization).
- Cost Per Hour -- total event costs divided by total hours.
- Lifetime Cost -- sum of all maintenance event costs over the hour range.
Analysis Tabs
Cost Analysis
A detailed table of every profile event showing:
- Activity type (MAINTENANCE, OPERATION, INSPECTION, FINANCIAL)
- Component name and location
- Target hours (interval between events)
- Cost per event, event count, cost per hour, and total cost
- Summary totals for cost per hour and lifetime cost
Year-by-Year Tables
Breaks down costs by year with escalation factors applied:
- Start/end hours for each year
- Event count and costs with FX, parts, and labor escalation multipliers
- Cumulative cost and cumulative cost per hour
- Expandable detail showing individual events per year
Cost escalation is split 70% parts (affected by parts escalation and FX) and 30% labor (affected by labor escalation). Multipliers compound annually.
Spend Charts
Visual analysis with configurable time granularity (monthly, quarterly, or yearly):
- Spend Timeline -- stacked bar chart by activity type showing costs over time with escalation applied.
- Total Spend Trend -- line chart of total costs per period.
- Activity Breakdown -- pie chart of total cost by activity type with percentage table.
What-If Analysis
Model alternative scenarios without changing your base data:
- Cost Multiplier -- apply a global cost adjustment (e.g., 1.2 for 20% increase, 0.8 for 20% decrease).
- Premature Failures -- select individual components and set a premature failure rate percentage. This reduces the target hours for that component, increasing event frequency. For example, 20% premature failure on a 5,000-hour component means it fails at 4,000 hours instead.
- Side-by-side comparison of original vs. what-if cost per hour, lifetime cost, and per-component impact.
Profile Comparison
Compare two lifecycle profiles side by side:
- Select a second profile to compare against.
- View cost per hour, lifetime cost, and event count for each profile.
- See the absolute and percentage difference.
- Bar chart comparing both profiles visually.
Scenario-Based TCO (API)
Scenarios
TCO scenarios are named configurations stored in the TcoScenario table:
| Field | Description |
|---|---|
name / slug | Human-readable name and URL-friendly identifier |
years | Analysis period (1--15 years) |
annualHours | Expected annual operating hours (100--10,000) |
availabilityPct | Target availability percentage (10--100%) |
purchasePrice / residualValue | Capital cost inputs |
discountRatePct | Discount rate for NPV calculations |
annualProduction / productionPerHour | Production volume for cost-per-tonne calculations |
productionUnit | Unit of production (e.g., tonnes) |
useHistoricalCosts | Whether to pull actual costs from financial records |
siteId / profileId | Scope the scenario to a specific site or profile |
assumptionsJson | Custom assumptions as a JSON object |
Scenario Assets
Each scenario can include specific vehicles via TcoScenarioAsset records. Assets can be toggled in or out of the scenario and can have per-asset overrides for annual hours, fuel consumption, labor rates, and maintenance multipliers.
TCO Summary Calculation
When you request a scenario summary, the system:
- Loads the scenario with its associated assets and vehicle details.
- Filters assets by the scenario's site and profile scope.
- Aggregates historical financial records by type (FUEL, MAINTENANCE, PARTS, LABOR).
- Computes capital cost as
purchasePrice - residualValue. - Calculates totals:
totalTCO,costPerYear,costPerHour, and optionallycostPerTonne. - Builds per-asset and per-site breakdowns when historical costs are enabled.
Simulation
The simulateScenario endpoint performs a what-if calculation without saving. It accepts the same parameters as scenario creation and returns the same breakdown structure, allowing you to preview results before committing to a scenario.
Benchmark Cost Assumptions
The getBenchmarkCostAssumptions endpoint uses Weibull reliability analysis on historical failure data to estimate:
- Mean time between failures (MTBF) per component
- Annual replacement frequency based on 5,000 operating hours
- Estimated replacement costs from linked parts catalog data
- Total annual maintenance cost projection
This helps inform scenario assumptions with data-driven estimates.
Common Questions
What is the difference between the TCO page and TCO scenarios?
The TCO page (/lifecycle/tco) is a profile-based calculator that models costs from maintenance events with economic escalation. TCO scenarios (API-driven) aggregate actual historical financial data across your fleet. Both can be used together -- the calculator for forward-looking modeling, scenarios for historical analysis.
How does escalation work?
Escalation factors compound annually. For Year N, the multiplier is (1 + rate/100)^N. Costs are split 70/30 between parts and labor, with parts affected by both FX and parts escalation, and labor affected only by labor escalation.
What is a premature failure rate?
It models the percentage by which a component fails earlier than its target hours. A 20% premature failure on a 5,000-hour target means the component is expected to fail at 4,000 hours, increasing the number of replacement events over the machine's life.
How is cost per tonne calculated?
Total production is computed from either annualProduction * years or productionPerHour * annualHours * years. Cost per tonne is then totalTCO / totalProduction. This metric is only available when production parameters are configured.
Can I compare scenarios?
The profile comparison tab lets you compare two lifecycle profiles. For scenario-level comparison, create multiple scenarios with different parameters and compare their summary outputs.